Women in politics in Africa: what the regional average conceals
Sub-Saharan Africa holds the world’s third-highest regional share of women in parliament, at 27.1% of lower-house seats as of 1 January 2025.[1] That is a real figure representing genuine progress from 10% in 1995.[2] It is also a simple country average, calculated by summing national percentages and dividing by the number of countries, not by weighting for population or examining the layers of power that sit above a parliamentary seat. Read alongside the fuller picture, it flatters more than it measures.
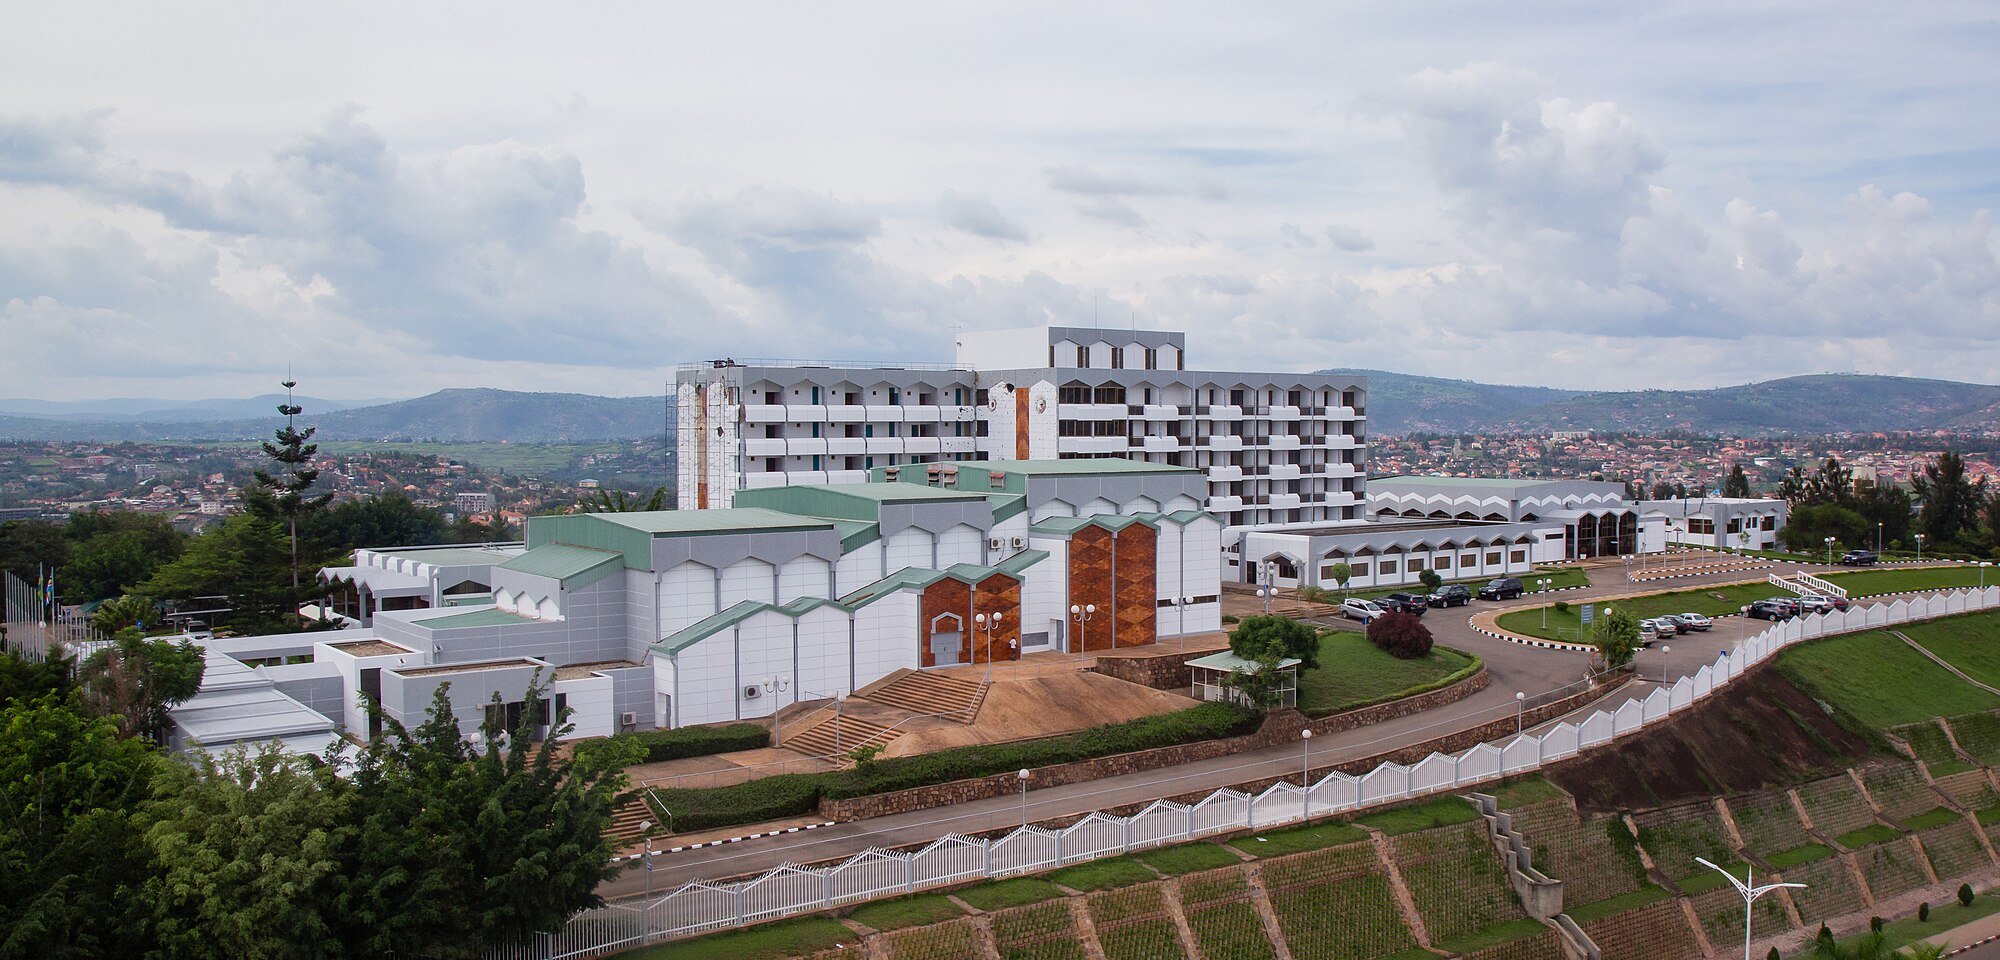
Rwanda Parliament Building, Kimihurura, Kigali. Rwanda holds the world's highest share of women in parliament (63.8%).
What this entry examines
- Whether the regional average accurately reflects the share of African women living in countries with meaningful representation
- Whether cabinet appointments and parliamentary seats tell the same story
- Where, above parliament, women’s representation stops translating into authority
27.1%
9%
The average is not the picture
The regional average treats Nigeria (220 million people, 3.9% women in parliament) the same as Rwanda (14 million, 63.8%).[3] Each country counts as one unit in the calculation.[1] A population-weighted estimate, derived from IPU country figures and UN Population Division data for sub-Saharan African countries, brings the representative share closer to 25%, because the continent’s two most populous countries, Nigeria and the Democratic Republic of the Congo (approximately 100 million people, 13%), both sit far below the regional mean.[5]
The within-region spread is the widest of any world region. The 60-point gap between Rwanda (63.8%) and Nigeria (3.9%) is larger than the entire range of women’s representation across all of Europe.[1] Six African countries, Rwanda, South Africa, Cabo Verde, Ethiopia, Senegal, and Namibia, have reached 40% or above. Three others, Guinea-Bissau (9.8%), the Gambia (8.6%), and Nigeria (3.9%), sit below 10%.[2] The 27.1% average lands between those two groups. Averaging them treats the region as one thing when it behaves like two. Statistically and politically, SSA is not one place on this indicator.
Women in parliament, selected sub-Saharan African countries
So what this means
This chart shows where the 27.1% comes from, and why it is a country average rather than a measure of how many African women actually live under meaningful representation.
Rwanda and Nigeria each count as one country in the SSA average. Nigeria alone has more than fifteen times Rwanda’s population. The regional average does not weight for this.
The structural divide is partly explained by electoral systems. In African countries using proportional representation with voluntary party quotas, women hold an average of 44% of parliamentary seats. In countries using first-past-the-post systems with no quota, that figure drops to 8%.[2] Nigeria uses the latter combination. Rwanda’s constitution mandates a 30% minimum for women at all levels of government, enforced through reserved seats in a mixed electoral system.[2] Forty-one of the fifty-four African states have some form of quota in operation at the national or local level, but the Barometer notes that quotas in first-past-the-post systems have generally not been effective in practice.[2]
Where elections fall short, appointments compensate
Across Africa as a whole, cabinet representation (24%) sits marginally below parliament (26%), which suggests that presidential appointment is not, at continental scale, more gender-balanced than electoral results.[2] At the country level, however, the pattern divides sharply.
In Madagascar, Sao Tome and Principe, Liberia, and Togo, women hold between 32% and 43% of cabinet posts while holding between 11% and 15% of parliamentary seats. The gap in Madagascar (42.3% cabinet, 14.1% parliament) is 28 percentage points; in Sao Tome (41.7% cabinet, 14.6% parliament) it is 27 points.[1] All four countries operate under first-past-the-post or mixed systems without effective legislated candidate quotas for national elections.[4]
Women in cabinet and parliament, countries where appointment leads
So what this means
The pattern here is that high cabinet figures can coexist with very low parliamentary ones, which raises the question of whether appointment-based representation is a complement to electoral progress or a substitute for it.
One reading is that progressive heads of state are compensating for structural failures in electoral design. An alternative reading is that representation resting on presidential discretion is inherently precarious: it can be reversed without any legislative barrier when officeholders or priorities change. The data cannot determine which reading is more accurate. It can establish that in these countries, the electoral route to representation has not been fixed.
The reverse pattern also exists. In Rwanda, Senegal, and Mozambique, parliamentary representation exceeds cabinet by 10 to 38 percentage points, suggesting that where constitutional or legislative quotas have driven electoral results, executive appointments have not kept pace.[1]
The ceiling above parliament
Parliament is not where representation stops being measured. The International IDEA and Gender Links Africa Barometer 2024 tracks ten women’s political participation indicators across Africa, from electoral management bodies to top executive positions.[2] At every step up the authority ladder, the share falls.
Election management bodies and capital city mayors, both partly or fully appointment-based, sit highest at 29% and 30% respectively. Parliament and speakers follow at 25% to 26%. Cabinet falls to 24%. Top executive positions, meaning presidents, vice-presidents, and prime ministers, stand at 13%.[2]
Women's representation by position across Africa, 2024
So what this means
Read top-to-bottom, the cascade thins at every step above parliament, and the one indicator that has moved in the wrong direction is the one that controls access to future gains.
The sharpest finding is at the base of the structure, not the top. Women’s representation in political party leadership, the positions from which electoral lists are built and candidates are selected, fell from 12% to 9% between 2021 and 2024. It is the only indicator among the ten tracked by the Barometer to have declined.[2] Seventy percent of African countries provide direct public funding to political parties, but only 17% direct any of it toward women’s political participation.[2]
The party leadership decline matters beyond its size. Parliamentary seats protected by constitutional quota mandates are structurally hard to reverse. Seats gained through party selection are not. If the people controlling candidate lists are increasingly male, future parliamentary gains become contingent on the goodwill of gatekeepers rather than on a structural guarantee.
The headline figure for 2025 can hold steady while the conditions for improving it narrow. The Barometer records a gain of just one percentage point in African parliamentary representation between 2021 and 2024.[2] A weakening party pipeline makes even that pace harder to sustain.
Globally, the portfolio pattern reinforces the ceiling effect. Women hold 87% of gender equality and social affairs ministerial posts, and between 12% and 14% of defence, energy, finance, and foreign affairs portfolios.[1] Country-level portfolio breakdowns for Africa are not disaggregated in the 2025 dataset, but the global pattern provides a directional reference for where women’s political authority is likely to sit.
Limitations
- The SSA regional average of 27.1% is from IPU Women in Politics 2025, reflecting elections and appointments up to 1 January 2025. The Africa Barometer 2024 reports the continental Africa average (54 states, including North Africa) at 26% as of mid-2024. These are different scopes and reference dates; both are used in this entry with their respective figures.
- The population-weighted estimate of approximately 25% is a derived calculation combining IPU 2025 country figures with UN Population Division 2024 estimates for a partial panel of sub-Saharan African countries. It is an approximate directional estimate, not a published figure, and should not be cited as a primary source.
- The cabinet-parliament gap analysis uses IPU 2025 figures for both measures as of 1 January 2025. For countries with elections or cabinet reshuffles after that date, figures will have changed.
- The ten-indicator power cascade is from the International IDEA Africa Barometer 2024, covering all 54 African states where data is available. The figures are Africa-wide averages across countries with data; not all positions are reported for all countries.
- Global portfolio segregation figures (87% gender equality, 12–14% defence and finance) are from IPU / UN Women 2025, based on a 189-country sample. Africa-specific breakdowns at this level of detail are not available in the current dataset.
- The electoral system and quota interaction figures (44% vs 8%) are from the Africa Barometer 2024 and reflect Africa-specific patterns. They do not control for income levels, political stability, or other country-level factors.
Sources
Primary
- Inter-Parliamentary Union (IPU) and UN Women. Women in Politics: 2025. March 2025. Situation on 1 January 2025. https://www.ipu.org/resources/publications/infographics/2025-03/women-in-politics-2025
- International IDEA and Gender Links. Women’s Political Participation Africa Barometer 2024. Second Edition. ISBN 978-91-7671-780-6 (PDF). https://www.idea.int/sites/default/files/2024-07/womens-political-participation-africa-barometer-2024.pdf
Context
- United Nations, Department of Economic and Social Affairs, Population Division. World Population Prospects 2024. https://population.un.org/wpp/
- International IDEA. Gender Quotas Database. Updated continuously. https://www.idea.int/data-tools/data/gender-quotas-database
- Open Ordinal. Population-weighted estimate combining IPU 2025 country-level parliamentary representation figures with UN Population Division 2024 mid-year estimates for sub-Saharan African countries. A partial country panel was used; the result is an approximate directional estimate and not a published statistic.